Caltrans’
New Technology and Research Program
John Slonaker
MAT 293
Instructor: Kevin Almeroth
June 14, 2001
Introduction
This report describes some of my activities as an electrical
engineer with the Caltrans’ (The
California Department of Transportation) New Technology and Research Program
during the Spring 2001 quarter. One of
the Program’s activities is to fund university research in technologies expected
to support Intelligent Transportation Systems
(ITS). My office, within the
program, funds research based at UCSB and other California Universities. One of these research projects is currently
being carried out at the Center For
Research in Electronic Art Technology (CREATE). Some of the research staff of CREATE are also faculty and staff
members of the MATP, and it is through this affiliation that I came to enroll in
the program. My duties include
monitoring the progress of, and providing technical support to, the research
projects. I also provide local area
network support for my office as well as wide area network support for the
offices within the New Technology and Research Program. I was particularly busy with this function
since my office moved into a new building during the quarter.
The ATON Project
CREATE and MATP staff are currently researching a Caltrans
funded project called ATON, which is short for Autonomous Transportation agents
for On-scene Networked incident Management.
The project is a collaborative effort among CREATE, the Computer Vision and Robotics Research
Laboratory at the University of California, San Diego, and my office, the
Caltrans Test-bed Center For
Interoperability. The main goal of
this project is to find technical solutions for the design of an automated traffic-incident detection, monitoring and recovery
system. This design includes clusters
of video and acoustic sensors, mobile robotic agents and interactive multimedia
workstations and interfaces, connected using high-speed communication
links. The researchers at UCSD are
working with Omni-Directional Video Sensors (ODVS), which use a focal
plain array camera that points straight up into a parabolic mirror. They then process the resulting image with
software that re-maps the radial coordinates to equivalent plainer coordinates
in order to “flatten” the view. These
cameras work in conjunction with conventional “rectilinear” cameras that
provide higher resolution of selected views.
The system is described in more detail here, and some
results are shown here.
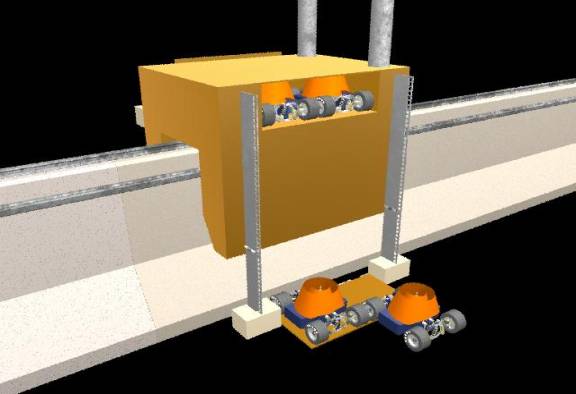
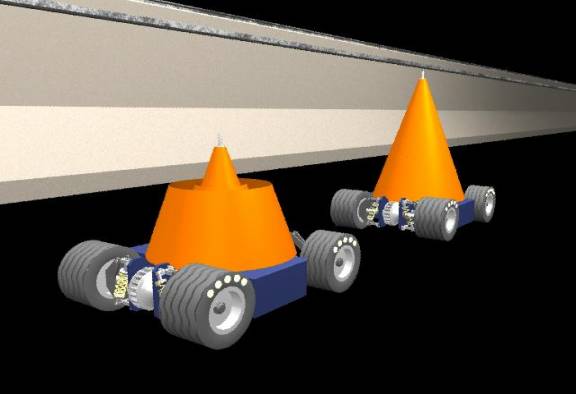
In support of this project, I developed
an animated computer simulation of the robotic incident response system that is
envisioned by the ATON researchers.
This will provide a way to quickly and concisely present the basic idea
of the project to anyone interested in learning about, or possibly providing
additional funding for, the project.
Using a program called Maya, from Alias Wavefront, I modeled the system
as a two-car monorail that travels on the concrete median, or “K-rail,” of a
freeway to the site of an incident.
Upon its arrival, the system deploys a CMS (Changeable Message Sign) to
alert motorists of the incident, ODVS and rectilinear cameras to allow remote
operators to closely monitor the incident site, and wireless-controlled
miniature vehicles carrying expandable cones to cordon off the area of the
incident. The animation is about a
minute in length and shows the process happening from various “camera angles,”
or virtual points of view. Figures 1-A
through 1-J below show selected frames from the animation in order to give an
idea of how it looks.
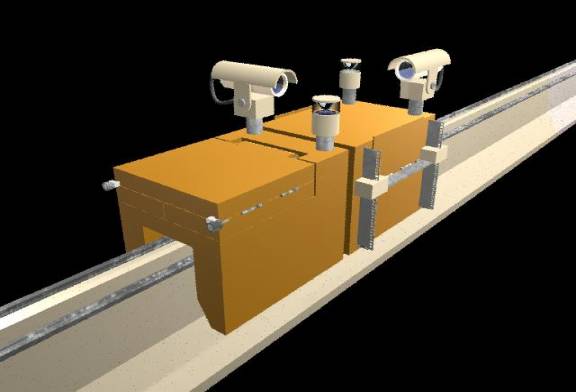
Figure 1 - A
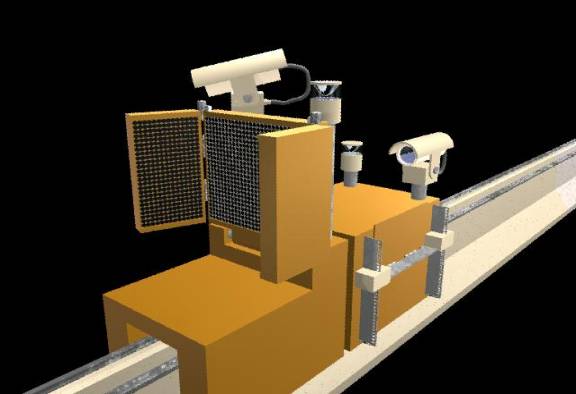
Figure 1 - B
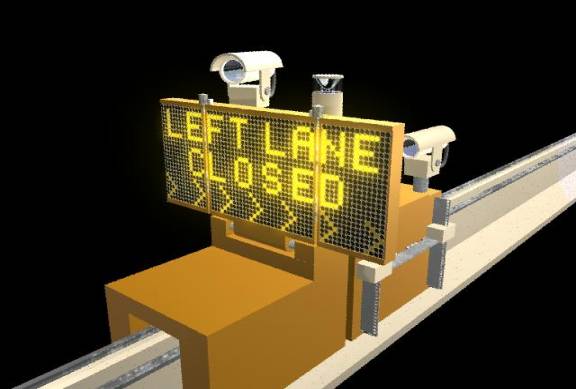
Figure 1 - C
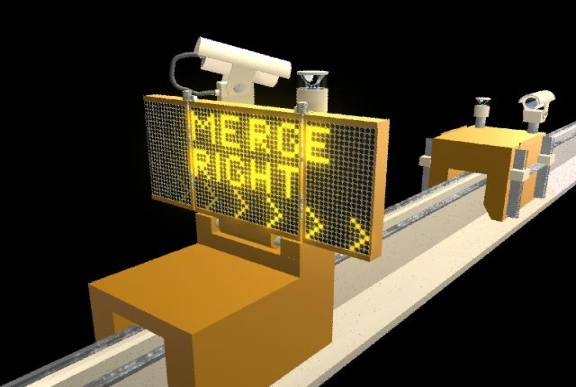
Figure 1 - D
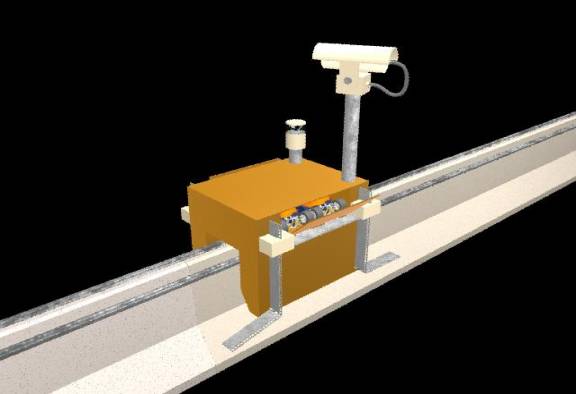
Figure 1 - E
 Figure
1 - F
Figure
1 - F
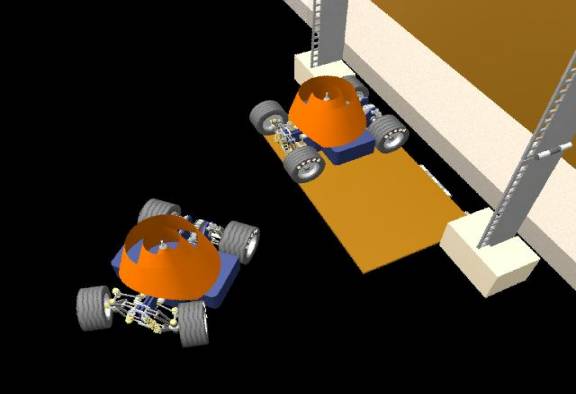
Figure 1 - G
 Figure
1 - H
Figure
1 - H
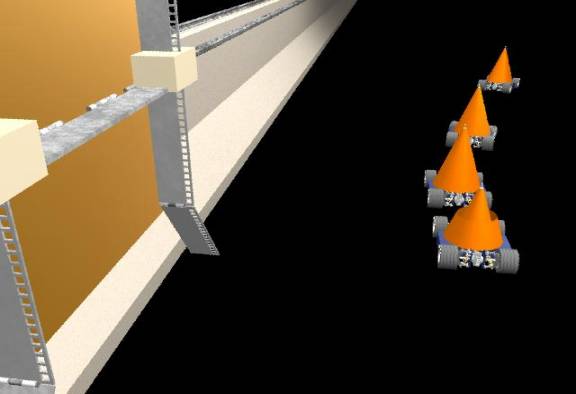
Figure 1 - I
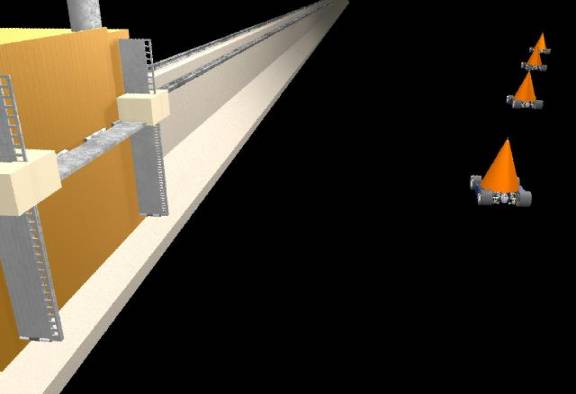
Figure 1 - J
Inductive
Loop Signatures Embedded in Video
Another Caltrans funded project being worked on at
UCSB involves a technique known as “Data Hiding,” where a digital file is
embedded into a digitized video stream and can later be extracted. This can be used for security applications,
but it is also convenient for automatically correlating data with a
corresponding video clip. Caltrans’
idea is to use this technology to provide files for automated vehicle
identification using both machine vision and inductive loop signature
technologies. Caltrans is looking for
ways to automatically identify and re-correlate vehicles on a given stretch of
highway. This ability can be used to
detect incidents and congestion and to determine up-to-the-minute travel
times. Therefore, the data to be “hidden”
in a video clip of a specific vehicle is that vehicle’s corresponding inductive
loop signature.
A conventional inductive loop detector
consists of an insulated wire, which is coiled and embedded in the pavement,
and an electronic detector card. The
detector card is physically connected to the coiled wire, typically through a
cable in an underground conduit, and sends alternating current through the
coil. This arrangement is basically an
LRC circuit, where the coil of wire is the inductor, or “L,” in the
circuit. This circuit can be tuned to
resonate at a certain frequency. When a
vehicle passes over the coiled wire, its metal provides and easier path than
air for the magnetic field induced by the current in the wire to travel
through. This causes a shift in the
resonant frequency of the circuit, which can be used to measure the change in
inductance of the wire coil. In conventional
applications such as traffic signals, the detector card provides a bivalent
(“on” or “off”) output to a micro-processor based traffic controller when the
inductance has changed above a settable threshold. Hence, the only information provided is whether there is a vehicle
on top of the wire coil. In a “speed
trap” configuration, the speed of a vehicle can be determined using two loop
detectors, with the two wire coils placed close together in the same lane. The controller can then be programmed to
measure the time between “on” signals from the two detector cards and divide this
number into the distance between the two wire coils.
Recently, detector cards have been
developed with electronics that run fast enough to measure changing inductance
values many times as a vehicle passes over the loop. By storing the measured values, an “inductive signature” is
produced that is characteristic of certain classes of vehicles, or, given
enough measurements, even individual vehicles.
These measurements can also be used to determine the speed of a vehicle
passing over a single loop by determining the “slew rate,” or rate of change in
inductance values during the leading and trailing edges of the signature (See
Figure 2). The loop signatures that the
New Technology and Research Program have obtained from its industry partner
have a “sample rate” of 4 Khz (i.e. there is a discrete inductance measurement
every 0.25 milliseconds). It is hoped
that through this research project, and others like it, techniques will be
developed to gather and fuse enough information in the field to allow remote
processing centers to automatically identify and re-correlate vehicles on a
given stretch of highway.
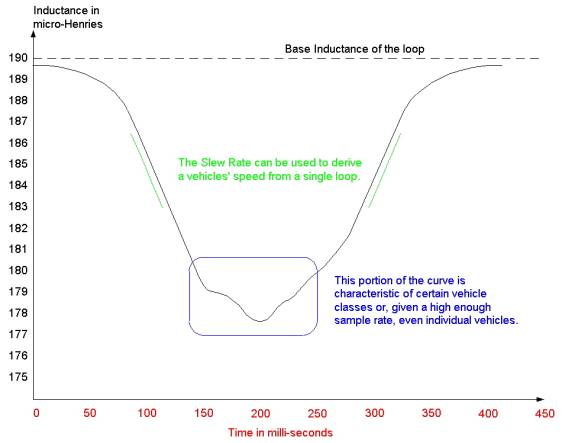
Figure 2
Office
Relocation
During the Winter 2001 quarter, we moved
our off-campus facility to a temporary location, and this past Spring 2001
quarter, we finally moved it to its permanent location at 6950 Hollister
Avenue. Because the office building
into which we moved is new, there were no interior walls; it was basically a
shell, and our lease included an architect and contractor to design and build
our new office space. I worked with
these people during the planning and construction phases to specify the floor
plan and the layout of the electrical circuits and communications outlets (See
Figure 3). I also worked with UCSB
communications services to specify lines we needed pulled from the building’s
main communications room to the UCSB/Caltrans communications room (room number
1 in Figure 3). One of these lines was
a multi-mode fiber cable to accommodate an OC-3 SONET (synchronous optical
network) circuit from Cox Communications that is used to link our on campus LAN
in 3432 South Hall with the LAN at our new office (See Figure 4 in the next
section). Another line is a “D-screen”
cable containing two shielded twisted pairs that will be used for our ISDN PRI
(primary rate interface) line. This
line consists of a T-1 line, which provides the layer one protocol, and ISDN
signaling, which is transmitted on channel 24 of the T-1 line and provides the
layer two protocol. This allows the
line to be switched through the phone company just like a POTS (“Plain Old
Telephone Service”) line, instead of being just a point-to-point connection
like a conventional T-1 line. The
terminal equipment for this line is an Ascend MAX 6000 IMUX (Inverse
Multiplexer) which, in turn, connects to a PictureTel Concorde 4500ZX video
Conferencing system. Finally, a copper
pair cable was pulled for our POTS and ISDN BRI (basic rate interface) lines.
Now, at the end of the Spring quarter,
we’ve finally moved in all of our furniture and have Internet, phone and video
conferencing connectivity to our new office.
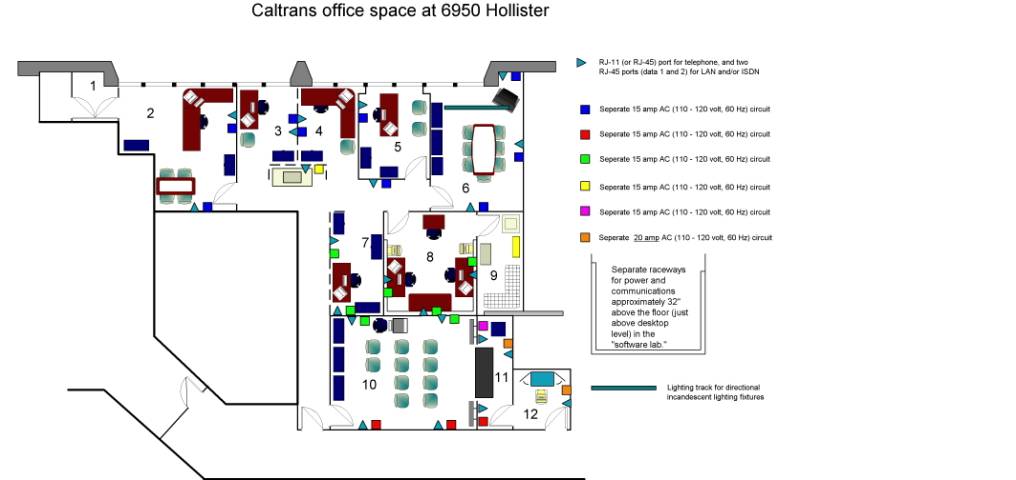
Figure 3
CalREN-2
CalREN-2
is short for California Research and Education Network, and links various
California Universities and research institutions via high speed OC-12 and
OC-48 fiber optic connections. During
the Spring quarter, I helped establish an OC-3 (155 mbps) VC (Virtual circuit)
from our facility at 6950 Hollister Avenue to the Computer Vision and Robotic
Research Laboratory at UCSD. This link uses the CalREN-2 infrastructure from
the UCSB switch-room to UCSD.
The first step in doing this was to
relocate one of our ATM switches and re-patch some fiber pairs and
jumpers. In our previously existing setup
(See Figure 4-A), the Fore ASX200BX switch sat in our South Hall lab on
campus. I needed to connect a port on
this switch to one on the “CENIC” (Corporation
for Education Network Initiatives in California) switch (Cisico Light
Stream 1010), which is the gateway to CalREN-2. The CENIC switch sits in the UCSB switch-room along with the
Positron fiber MUX that provides our link to the Cox Communications SONET ring
and, thus, links our on campus LAN with the LAN in our off campus facility at
6950 Hollister Avenue. Ideally, I would
have used one of the muli-mode fiber pairs in a six pair cable that runs from
South Hall to the switch-room, but as can be seen in Figure 4-A, all six pairs
were used. Therefore, I had to move the
ASX200BX to the switch-room so I could connect it to the CENIC switch with a
fiber jumper (See Figure 4-B). I used
another fiber jumper to connect the ASX200BX to the Positron fiber MUX. This freed fiber pair 5 & 6, which I
used to connect the ASX200BX to our Fore 2810 Ethernet-to-ATM hub, which
remains in the South Hall lab. Finally,
I installed an ATM NIC in a PC and connected a fiber jumper from the NIC to a
port on the ASX1000 switch at 6950 Hollister Avenue.
Once the physical connections were in
place, it was time to configure the logical ones. The goal was to establish an IP connection between the PC at 6950
Hollister and a PC in the CVRR lab at UCSD.
Host PCs connected to the ES-3810 at 6950 Hollister and the ES-2810 in
3432 South Hall are logically bridged through a LANE (LAN Emulation) VLAN
configured on the Fore ATM switches.
The PCs at the CCVR Lab to which we needed to connect are attached
through an Ethernet module to a 3COM Cellplex 7000 ATM switch, which also runs
the LANE VLAN protocol. Unfortunately,
the CENIC switch and other CalREN-2 equipment don’t support virtual LAN
protocols. Therefore, I configured the
ATM NIC at 6950 Hollister to run the RFC 1577 classical IP (CLIP) over ATM. In this configuration, the IP addresses of
the ATM NIC and an interface on a Cisco 7500 router at the UCSD end of the
virtual circuit are statically assigned (i.e there is no ARP server). I then configured a PVC (permanent virtual
circuit) from the port on the ASX1000 into which the ATM NIC plugged, to the
port on the ASX200BX that was jumpered to the CENIC switch. I set the VCI (virtual channel identifier)
and VPI (virtual path identifier) numbers to match the ones on the PVC that the
CalREN-2 netwrok guy had configured to exit the CENIC switch. At the UCSD end, the PVC exits CalREN2 at a
Cisco 8540 ATM switch and continues to a CLIP interface on the Cisco 7500
router. The Cisco 7500 converts IP packets from the CLIP protocol to the
LANE VLAN and passes them through the interface connected to the 3COM Cellplex
7000 ATM switch in the CVRR lab.
I can now ping a PC in the CVRR lab at
UCSD from the aforementioned PC at 6950 Hollister, and we now have a high-speed
dedicated link over which we can exchange IP data with the researchers at UCSD.
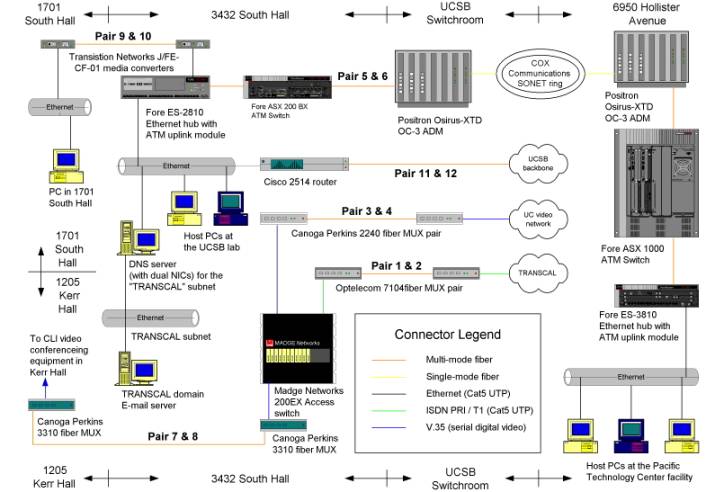
Figure 4 - A
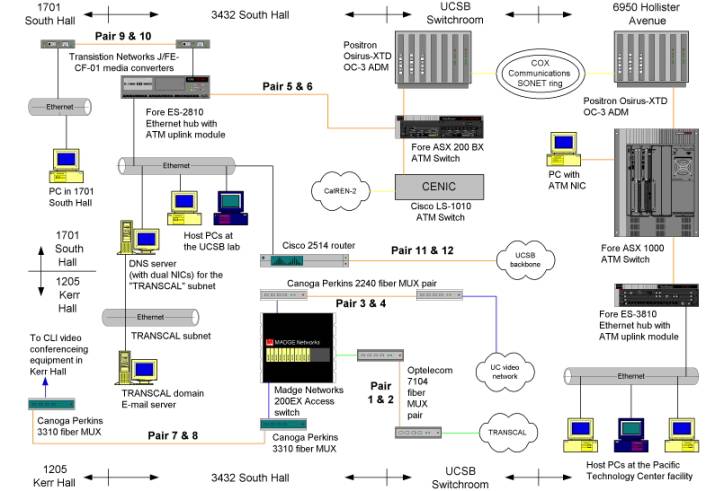
Figure 4 - B