Caltrans’
New Technology and Research Program
John Slonaker
Instructor: Kevin Almeroth
March 21, 2001
Introduction
I found out about the Media
Arts and Technology (MAT) program through my job as an electrical engineer
with the New Technology and
Research Program in Caltrans (The
California Department of Transportation).
One of the Program’s activities is to fund university research of
technologies expected to support Intelligent
Transportation Systems (ITS). My
office, within the program, funds research based at UCSB and other California
Universities and has facilities on campus as well as a couple miles off
campus. One of the projects we were
funding was research being done at the Center
For Research in Electronic Art Technology (CREATE). Some of the research staff of CREATE are now
faculty and staff members of the MATP and were looking for students to enroll
in their fledging program. Since MAT offers a course of study in “Multimedia
Engineering,” which includes courses covering many of the technologies in which
my office is interested, I was able to arrange to enroll in the program on a
part time basis.
The ATON Project
CREATE and MATP staff are currently researching a Caltrans
funded project called ATON, which is short for Autonomous Transportation agents
for On-scene Networked incident Management.
The project is a collaborative effort among CREATE, the Computer Vision and Robotics Research
Laboratory at the University of California, San Diego, and my office, the
Caltrans Test-bed Center For
Interoperability. The main goal of
this project is to find technical solutions for the design of an automated traffic-incident detection, monitoring and recovery system.
This design includes clusters
of video and acoustic sensors, mobile robotic agents and interactive multimedia
workstations and interfaces, connected using high-speed communication
links. The researchers at UCSD are
working with Omni-Directional Video Sensors (ODVS), which use a focal
plain array camera that points straight up into a parabolic mirror. They then process the resulting image with
software that re-maps the radial coordinates to equivalent plainer coordinates
in order to “flatten” the view. These
cameras work in conjunction with conventional “rectilinear” cameras that
provide higher resolution of selected views.
The system is described in more detail here, and some
results are shown here. A live, unprocessed view from an ODVS set up
on the UCSD campus can be seen here.
Another technology being
investigated for ATON is digital video segmentation, which is used to extract
images of individual vehicles and their respective shadows from a video feed of
a surveillance camera looking at traffic on a state highway. This will enable computers to automatically
detect incidents or congestion. The
system being developed by the ATON researchers uses a distributed activity
recognition database that decomposes complex activities into spatio-temporally
bounded primitive events, stores them, and provides querying mechanisms to
retrieve them. The query mechanism
includes rules for composition of complex activities. For example, a “collision of multiple cars” is a complex activity
that is defined as a set of patterns of less complex activities. These patterns
are built from primitive events like “car stops suddenly” or “car enters a
region,” where the “region” has been pre-define as a part of the road, as seen
from the camera’s view, not normally traveled by vehicles. The primitive events are detected by visual
and other signal processing layers and can be limited in number. The complex
activities are exponentially greater in number, but it is not necessary to
define them individually. In order to provide the researchers with more data,
I’m working to set up a video server using “Video Logger” software from a
company called Virage and “Real Producer” from Real Networks. I’ve compiled several video tapes of various
types of traffic patterns and incidents by tapping into live video feeds in the
Caltrans District 7 TMC (Traffic Management Center) in Los Angeles. Operators in the TMC can select from, and
simultaneously monitor, several feeds from cameras on freeways and city streets
in the Los Angeles area. The technology
being developed by the ATON project will enable computers to constantly monitor
the camera feeds and alert the operators of detected activity. I’ve procured and installed two video
capture cards in the computer on which I installed the aforementioned software. I will use this system to encode the analog
NTSC video signal from a VCR into compressed, streamable digital files. Once encoded, I can define and index clips
from the files showing specific traffic behavior and post them as hyperlinks to
be retrieved by the researchers. The
communications medium for this will be the CalREN-2 network, which I’ll mention
in more detail a little later.
I’m also working to render an animated
computer simulation of a robotic incident response system as envisioned by the
ATON researchers. Using a program
called Maya, from Alias Wavefront, I have modeled a system that travels on the
concrete median or “K-rail” of a freeway to an incident site and deploys a CMS
(Changeable Message Sign) to alert motorists of the incident, ODVS and
rectilinear cameras to allow remote operators to closely monitor the incident
site, and wireless-controlled vehicles carrying expandable cones to cordon off
the area of the incident. I still
intend to animate the model and add elements such as background, lighting,
textures and surface reflectivity to make it look realistic. In the mean time, you can try to get an idea
of the mechanics of the model in the low-resolution Figures 1a through 1h.
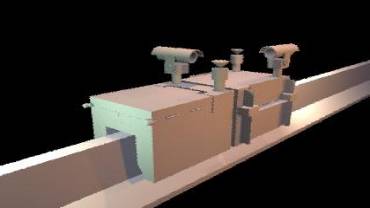
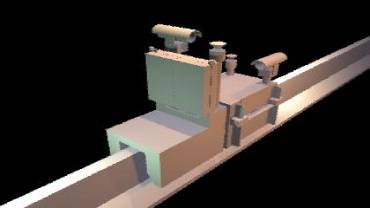
Figure 1a Figure
1b
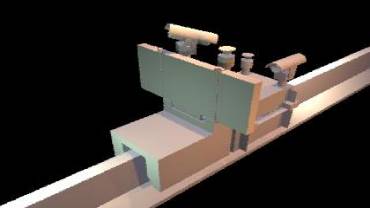
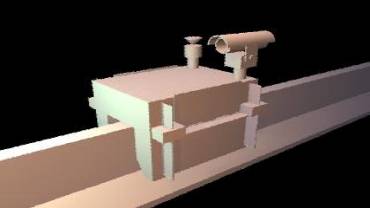
Figure 1c Figure
1d
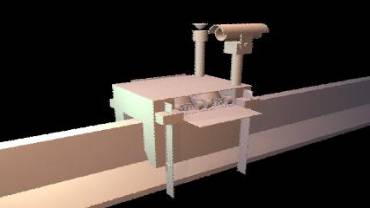
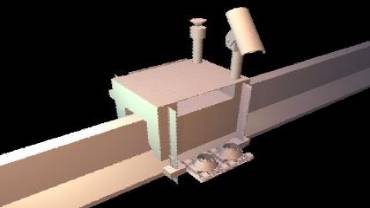
Figure 1e Figure
1f
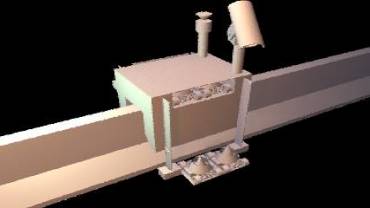
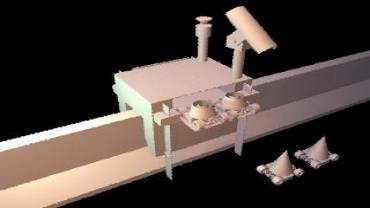
Figure 1g Figure
1h
CalREN-2
CalREN-2
is short for California Research and Education Network, and links various
California Universities and research institutions via high speed OC-12 and
OC-48 fiber optic connections. I am
currently working to establish an OC-3 (155 mbps) VC (Virtual circuit) from our
facility on the UCSB campus to the Computer Vision and Robotic Research Laboratory
at UCSD. This involves establishing a
physical single mode fiber link from our facility to the main UCSB switch room,
which is about a mile away. This link
will be between the Fore ASX 200BX ATM switch in our facility and a Cisco
Lightstream ATM switch in the switch room.
The Fore switch has interfaces for both single and multi-mode fiber
interfaces, but the Cisco switch only has multi-mode interfaces. Because or this, I procured a media
converter from Black Box that will sit in the switch room between the two ATM
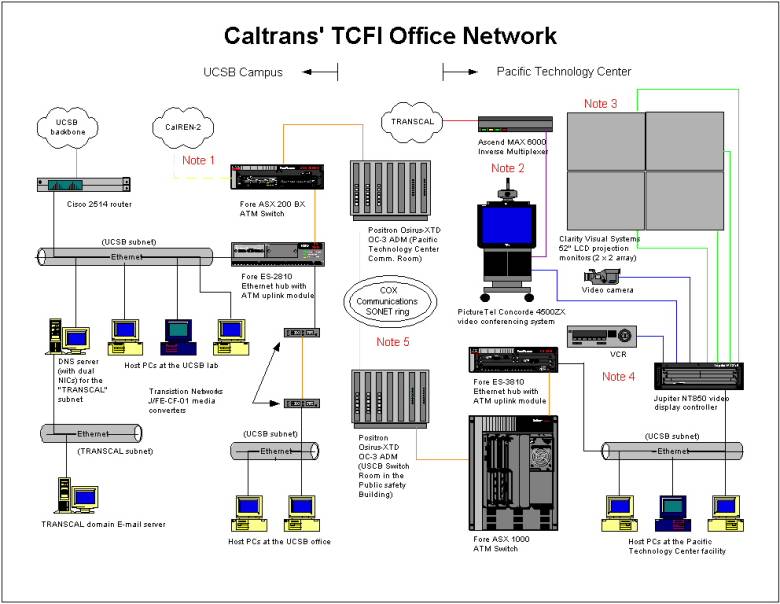
switch ports. (Please see note 1 in
Figure 2.)
Another thing I did in preparation for this link was work with UCSB
Communications services to update the configuration of the router that connects
the LAN in our facility to UCSB’s main backbone fiber. The CalREN-2 VC will effectively extend a
portion of this LAN to the Computer Vision and Robotic Research Laboratory at
UCSD. In order to prevent anyone there
from hooking this portion onto another subnet and routing other UCSD or Internet
traffic across the CalREN-2 VC (or even running spoofing attacks by
"impersonating" a host not on our subnet), we set up "access
lists" that only permit routing (in-bound and out-bound) of packets whose
addresses start with the class C network address of our LAN, which is a good
security precaution in general. We also
did a few other things to “modernize” the configuration. The router had been running RIP, which we
changed to OSPF (open Shortest Path First).
This enabled it to communicate with more other routers at UCSB (also
running OSPF) directly, without having to go through a RIP/OSPF translation
server. Also, it can now choose an
alternate route to the Internet if its regular gateway router goes down. This gateway router had previously had a
static route set up to forward traffic destined for our subnets to our router,
and it advertised this route on our router’s behalf. Now, our router advertises its own subnets, and can route
outgoing (outside UCSB) traffic through any router on the UCSB backbone that
has a path to the Internet. This didn’t
change the load on its CPU significantly; it is still under 10% in the steady
state. We added NTP (Network Time
Protocol) which enables the router to log events by time of day to aid in
troubleshooting. We added SNMP (Simple
Network Management Protocol) so a configuration management server can get our
router’s configuration file and store it for backup purposes. For security, we
specified that SNMP messages can only be exchanged between itself and the
configuration management server.
I’ve
submitted the administrative paper work and, at this point, I’m waiting for the
group that controls access to CalREN-2 to authorize the OC-3 bandwidth
allocation.
Network
Modifications for Office Relocation
During the Winter 2001 quarter, we moved
our off-campus facility to another location within the Pacific Technology Center. Besides moving equipment, this involved
relocating and re-terminating two data communications media (in addition to
moving the POTS--“Plain Old Telephone Service” lines). One of these is an ISDN (Integrated Services
Digital Network) PRI (Primary Rate -- 1.472 Mbps) line, which we use to connect
our video conferencing system to our multipoint video conferencing bridge as
well as other video conferencing systems at Caltrans and its research
partners. The physical medium for this
line is a “D-screen” cable containing two shielded twisted pairs which were
terminated to pins 1, 2, 4 & 5 (as opposed to 1, 2, 3 & 6 as in
Ehternet) of an RJ-45 jack on a patch panel.
The layer one protocol is a T-1 line, which is leased from Verizon. The layer two protocol is the ISDN
signaling, which is transmitted on channel 24 of the T-1 line and allows for
switching of calls at MCI’s DMS 250 switch (just like a POTS line). Our terminal equipment for this line is an
Ascend MAX 6000 IMUX (Inverse Multiplexer) which, in turn, connects to a
PictureTel Concorde 4500ZX video Conferencing system (please see note 2 in
Figure 2). The PictureTel system, as
well as other composite NTSC video sources, connect to the analog inputs of a
Jupiter NT850 system which is essentially a Windows NT computer with special
I/O hardware that enables it to display a composite image on four separate
monitors. These monitors are a 2 x 2
array of 52” LCD projection “cubes” from Clarity Visual Systems (please see
Note 3 in Figure 2). The system just
described allows NTSC composite video (including images of remote video
conferencing sites) as well as SVGA video from the computer to be presented on
a 104” “video wall” (Please See note 4
in Figure 2).
The other data communications medium is a
multi-mode fiber optic pair which is used to connect our terminal equipment, a
Fore Systems ASX 1000 ATM, with a Positron Osirus fiber multiplexer in the main
communications room of the Pacific Technology Center. The other end of this VC terminates at a similar Positron Fiber
MUX in UCSB’s main switch room. Our
terminal equipment on campus is Fore ATM mentioned in the previous section. (Please see note 5 in Figure 2.) The data transmitted on this link is IP over
LANE (“LAN Emulation”) over ATM (Asynchronous Transfer Mode) over SONET
(Synchronous Optical Network). The link
enables host PCs at our Pacific Technology Center facility to be logically part
of the LAN in our UCSB facility.
Figure 2