CS185 HW Assignment 4:
Field Work Data Entry and Visualization
Posted: Wednesday, April 24th, 1:00am
Due: Wednesday, May 1st, 23:59:59
Change Log:
Thu, Apr. 25, 1pm: Added information on implementing the location picker as a custom select component rather than a autocomplete text field (which are a bit harder to do with Bootstrap).
Thu, Apr. 25, 8pm: Clarification that SASS is not needed. Just use standard CSS.
In this homework you will implement an aesthetically pleasing UI for data entry based on the interface two from the previous assignment.
Goal
The goal is to gain further familiarity for developing interactive user interfaces using Javascript, CSS and HTML, specifically:
- implementation of form-based data entry, input groups, and button elements using the Bootstrap library
- use of responsive web design (RWD) principles,
- implementing JavaScript communication between the input forms and a custom visualization component
Breakdown of Deliverables
- Part 1: Implement data entry UI using Bootstrap library (60%)
- Functionality (forms: radio buttons, date and time pickers; input groups: custom select for location, number fields; 'submit' button)
- Layout of above components, Responsive Web Design (see animation below)
- Pre-population of date field with current date
- Part 2: Communicate entered data to a custom visualization component in JavaScript (40%)
- Stylization, Layout, Responsive Web Design on provided visualization elements
- Functionality: histogram aggregation, min/max dates, mean measurement values
We provide the following skeleton code for the visualization component.
Part 1: Data Entry UI
To implement this homework you will make use of the popular library Bootstrap (and, if desired, jQuery), to make your implementation easier. As we discussed in class, Bootstrap is a library that enables quick prototyping of UI ideas.
Your tasks for this section are follows:
The data entry interface should behave according to Responsive Web Design (RWD) principles. Bootstrap Layout takes care of a lot of things for this (such as media tags) behind the scene.
As an additional help, you can take a look at our ToDo list example from the Fri, Apr. 19 discussion session for a simple example of how to implement a customized Bootstrap webpage.
Part 2: Interactive Visualization
The above-linked skeleton code contains the basic unstyled components and some starter JavaScript code to aggregate and visualize entered data in a simple overview consisting of a histogram, mean measurement values, and an interval display of the minimum and maximum entry dates.
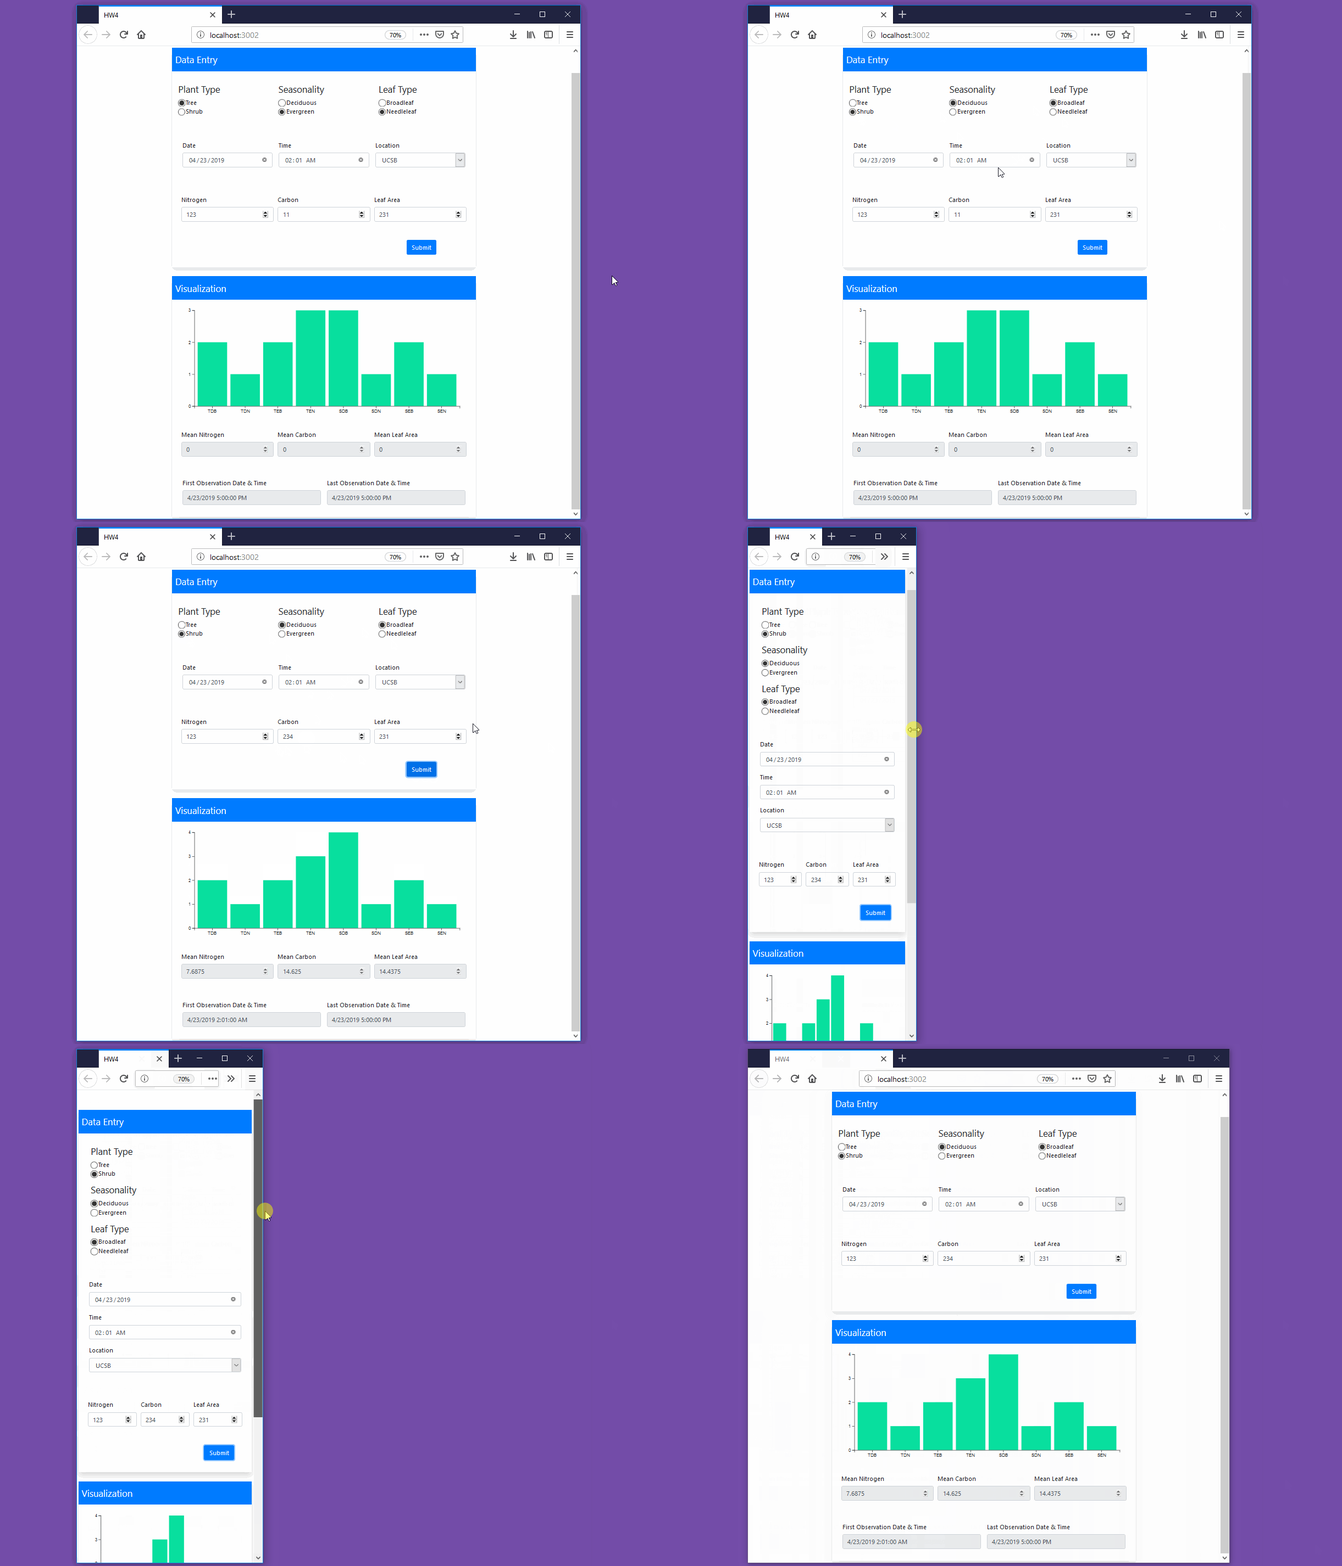
Here is an animation of how your data entry UI and the visualization layout should behave on resize:

Note that your UI might look slightly differently. Your implementation should implement the described functionality and follow good design principles and guidelines.
Submission
Please zip and submit the following items to Gauchospace:- index.html, style.css, script.js implmentation of your homework
- Readme.txt containing your design decisions, external resources used, challenges and critique of your homework.
Note that all testing and grading of your homework will be conducted on the latest version of the Chrome browser. Please make sure to test your submitted zip file (unpack it into a fresh folder and test it to see if it works as submitted). It is your responsibility to make sure the submitted code works.